System Science - Part 5: Sound Quality & Specs
How To Make Sense Of Audio Interface Specifications.
Your audio interface is potentially the most important piece of hardware in your studio, so it’s vital to choose one that is right for you. That means choosing an interface that will connect to your computer and work well with it. It means opting for a selection of analogue inputs and outputs that meets your current needs. It also means anticipating your future needs, and making sure you have the right digital inputs and outputs on hand to expand your system when the time comes.
However, once you’ve looked around at what’s available, you’ll probably find that multiple interfaces from different manufacturers offer very similar features. For example, there are many USB 2 audio interface that feature eight analogue inputs, a similar number of outputs, and one or two ADAT optical ports for expansion. What makes one of these better than another? One factor that comes up again and again in Internet reviews and discussions is sound quality. You’ll find endless forum posts saying that this or that interface offers superior audio quality, or advising you to choose one interface over another because its mic preamps sound better. Unfortunately, what’s all too rare in these discussions is consistency and common sense, while misinformation and received wisdom is rife. This is not helped by some manufacturers who publish misleading or partial specifications to present their products in the best possible light.
What We Can Measure vs What We Can Hear
There are differences in the sound quality of audio interfaces; and for the most part, these are down to factors that can be measured. The more you pay for your audio interface, the better it’s likely to perform on the test bench. However, it’s important not to overstate the extent to which these differences are likely to be audible. In other words, there might be objective ways in which one interface outperforms another, but these may well be difficult or impossible to hear in normal use.
For example, you can expect any audio interface on the market now to offer a frequency response that is flat to within half a decibel or better across the entire range of human hearing, on both inputs and outputs. What this means is that any frequency imbalances introduced by today’s audio interfaces will be as nothing compared with the failings of microphones, loudspeakers and acoustic treatment. In fact, in any normal listening environment, simply moving our head a few inches will introduce a much bigger changes in the frequency balance we hear, as the way in which direct sound from the loudspeakers combines with reflected sound changes from point to point. Setting up a fair comparison of subjective sound quality is notoriously difficult, and requires extremely rigorous preparation, level matching to 0.1dB or better, and a very good listening environment. It’s the sort of thing that audio interface manufacturers might do when fine-tuning the design of their latest and greatest product, but it’s very unlikely that comparing two interfaces in a shop or dealer showroom will reveal real differences between them. For this reason, we often need to resort to published specifications in order to try to compare the audio performance of two different interfaces. But which specifications are important, and how should we interpret them?
Design And Execution
Roughly speaking, we can divide specifications up into two categories: specifications that describe what something is designed to do, and measurements of how well it performs. In the first category, we could include factors such as the gain range of a mic preamp or the maximum output level of a line output. In the latter category, we find measurements of frequency response, noise and distortion. The first kind of specification can help us decide whether an interface actually meets our needs or not. Let’s have a look at some of the most important of them.
Analogue inputs, and especially microphone preamps, have to be able to cope with a wide range of different types of input. A sensitive microphone placed next to a snare drum will put out a very ‘hot’ signal, while a ribbon mic on an acoustic guitar will require far more preamplification before the signal can be recorded at an appropriate level. For this reason, any input designed for connecting a microphone will have a gain control that governs the amount of preamplification being applied. The wider the range of this gain control, the more versatile the mic preamp.
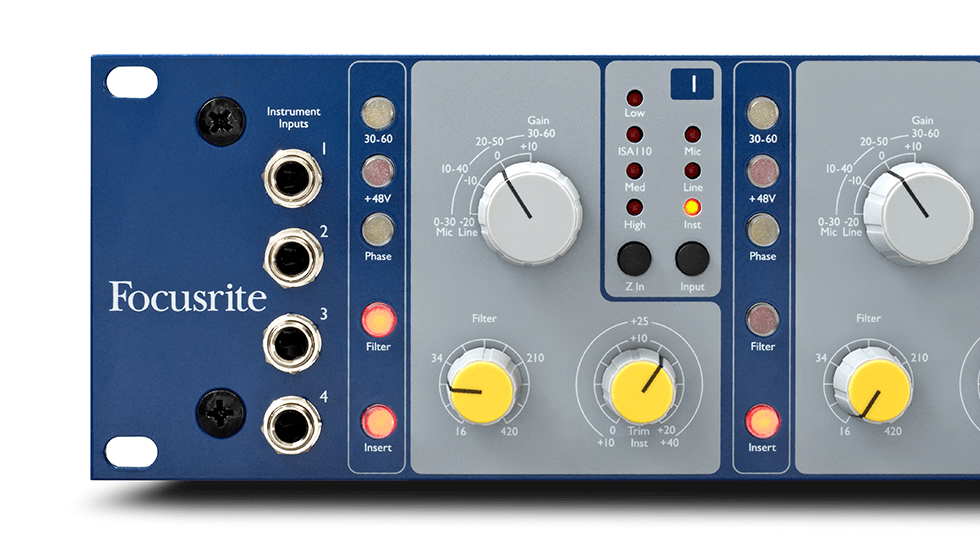
Focusrite’s ISA preamp design combines a very wide gain range with the ability to set gain very precisely, thanks to its use of a separate stepped control (grey, top) and fine trim control (yellow, bottom).
Some high-end stand-alone mic preamps, such as Focusrite’s ISA units, offer a total gain range of 80dB or so. This allows them to cope with the full range of microphone and source combinations you’re likely to encounter in any real-world recording situation. For the majority of recording applications, however, such a wide gain range isn’t really necessary, and most audio interfaces offer somewhere between 55 and 65 dB, which is sufficient for nearly all needs. This is sometimes extended by means of a switchable ‘pad’, which typically attenuates the signal by a fixed 15 or 20 dB, allowing very high-output sources to be connected without risk of overload.
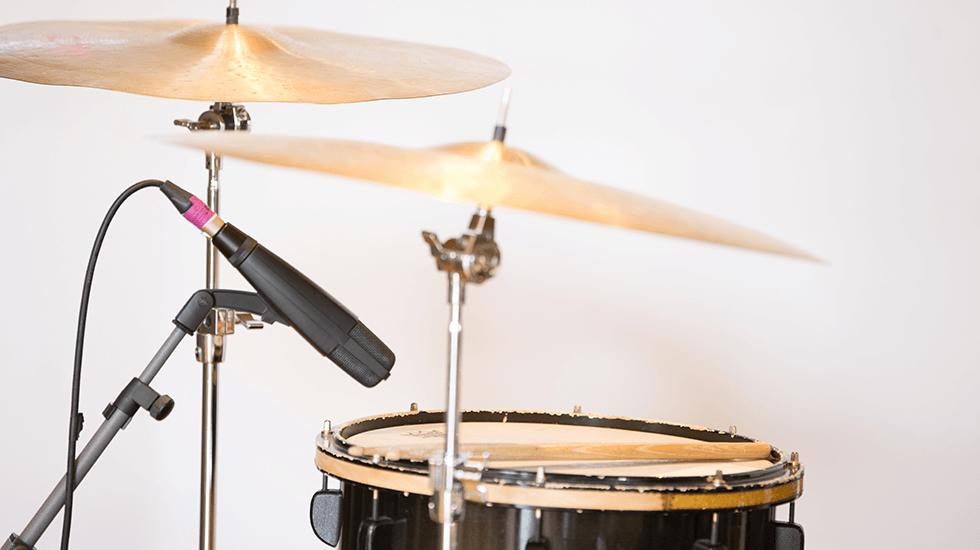
It’s important that your mic preamps have a wide enough gain range to accommodate both the loudest and the quietest signals you’re likely to encounter in recording sessions.
Note that two interfaces with the same gain range don’t necessarily behave identically: the preamps in interface A might span -5 to +55 dB while those in interface B might run from +5 to +65 dB, in which case both would have a 60dB gain range, but interface A would be better able to cope with very loud close-miked signals, while interface B would be a better choice for recording very quiet sources.
Making Gains
One factor that can make a big difference in practical terms is the way in which preamp gain control is implemented. On more affordable audio equipment, gain is usually adjusted using a simple potentiometer. This is quick and effective, and cheap to implement, but it tends to be imprecise and makes settings hard to recall exactly. Increasingly, therefore, interfaces targeting professional users, such as Focusrite’s Red 4Pre and 8Pre, use digitally controlled preamplifiers that allow gain to be set precisely in steps of 3dB or less. This is invaluable when you need to match gain across two or more channels, as is the case for stereo miking techniques.
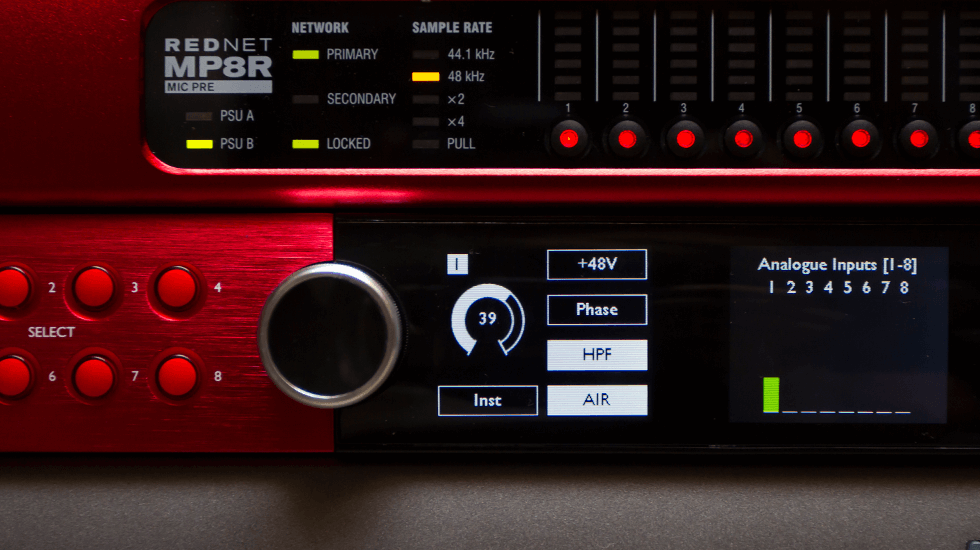
The advanced digital controls on Focusrite’s Red products allow gain to be set and recalled precisely.
Another specification you’ll often find listed for inputs is impedance. In general, microphone inputs typically present an input impedance somewhere between 1 and 7 kΩ, while line inputs are in the order of 10kΩ. If your interface has instrument inputs designed for directly plugging in an electric guitar or bass, these should present a much higher impedance, ideally at least 1MΩ. An interesting feature that’s available on some microphone preamps is the ability to vary the input impedance. This is part of what the Air circuit on Focusrite’s Clarett and Red products does, and it can make a difference to the sound of some microphones, though others are not sensitive to input impedance.
On many interfaces, especially those targeted at home and project studios, the line inputs are routed through the preamp stage, meaning that their gain is variable in the same way as that of the mic inputs. This gives them more flexibility to cope with lower levels put out by non-standard devices such as vintage synthesizers, but does not offer such a pure signal path. More costly interfaces usually give the line inputs their own direct path to the analogue-to-digital converter, for maximum fidelity. It’s often still possible to change the sensitivity of these inputs up to a point, though, either by means of a variable ‘trim’ control or by switching between the +4dBu ‘professional’ and -10dBV ‘consumer’ reference levels.
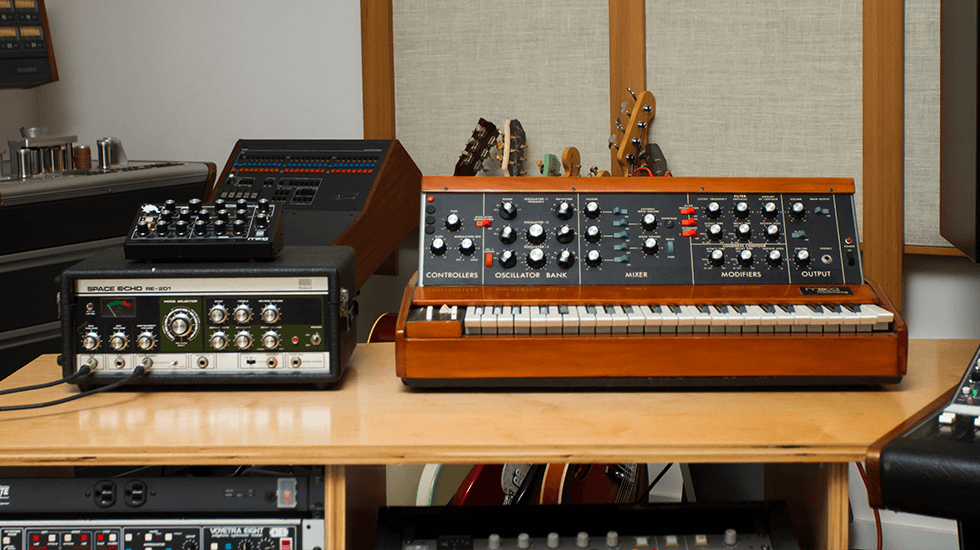
Unlike modern digital instruments, older analogue synthesizers and audio processors might not output a standard level, so having some gain available on line inputs can be useful.
As well as a gain range, a maximum input level in dBu is also usually specified for mic and line inputs. Similarly, a maximum output level will be quoted for the line outputs. This represents the voltage that will be delivered by a full-scale digital signal, and is relevant if you want to feed audio from the line outputs of your interface into other studio gear such as outboard processors, mixers or monitor controllers. For example, if the maximum output level of your interface’s line outs is much lower than the input level a compressor is designed to accept, you might struggle to drive the compressor hard enough to achieve heavy compression.
Peak Performance
So much for specifications that tell us how an interface is designed to behave. When we come to the ones that measure how well it performs, it’s often necessary to inspect published figures with a sceptical eye. As someone might have said, there are lies, damned lies, and specifications!
First of all, it’s vital to know exactly which aspect of the interface a given figure refers to, and this isn’t always made clear in published specifications. For instance, some unscrupulous manufacturers have been known to publish figures that only refer to the analogue-to-digital converter chips they’re using, rather than the entire input stage of the interface. These figures might look impressive, but they are largely meaningless: in the real world, it’s the performance of the input stage as a whole that matters.
Some manufacturers have been known to quote specifications that relate only to the analogue-to-digital converter components they use. These often look impressive, but have no relevance in the real world.
For line-level inputs and outputs, there are three key measurements. One is frequency response, which measures our interface’s ability to reproduce sound accurately without introducing unwanted changes to its timbre. Almost all interfaces on the market today perform very well in this respect, and you should certainly expect a quoted frequency response specification to be flat to within ±1dB between 20Hz and 20kHz, the conventionally accepted limits of human perception. Focusrite’s Clarett interfaces are an order of magnitude better, measuring flat within ±0.1dB in this range. Some manufacturers quote a much higher upper limit to the frequency response, such as 40kHz: this sounds impressive, but has little bearing on what we can hear, and is only relevant when recording at elevated sample rates.
Range Rovers
Almost all audio interfaces available today have a published frequency response that is pretty much perfect, so this doesn’t provide any grounds for comparing them. More telling are the figures for dynamic range: the ratio between, at one end of the spectrum, the loudest signal the interface can accommodate and, at the other, the quietest signal that is detectable above the noise floor.
The signals we record have a dynamic range of their own. For instance, a classical symphony might peak with 100 musicians playing triple-forte, and end with a solo violin playing softly. Its dynamic range would be the ratio between the loudest point of the loudest section, and the point where the reverberation of that solo violin fades out of hearing below the ambient noise in the hall.
We can think of the dynamic range of our recording system’s inputs and outputs as a ‘window’ through which the music we’re recording needs to fit. The wider the system’s dynamic range, the taller the window, and the more leeway we have in setting microphone gain levels so as to fit everything in.
Dynamic range is measured in decibels, and an ‘A-weighted’ figure is usually quoted. What this means is that greater emphasis (weight) is placed on that part of the frequency spectrum to which the human ear is most sensitive — roughly speaking, from 1–10 kHz. Unweighted measurements for the same piece of equipment will typically be several dB worse than the A-weighted figures.

Our hearing is much more sensitive to frequencies in the mid-range than it is to very low or high frequencies. This is reflected in the A-weighting standard used for some audio measurements.
In practice, the best-performing premium audio interfaces on the market today, such as Focusrite’s Red 4Pre, Red 8Pre and Red 16 Line achieve an A-weighted dynamic range of 120dB or better on line outputs and approaching 120dB on their line inputs. The Red interfaces’ class-leading output performance is made possible by the use of ‘parallel path’ conversion, a no-compromise design approach which splits the signal between two digital-to-analogue converters and adds together their outputs — because the wanted audio from both is correlated while the noise is not, this achieves a 3dB increase in the ratio of wanted signal to noise. More affordable interfaces that target the home and project-studio owner fall slightly short of this, but still achieve performance that would have been unheard-of ten years ago: Focusrite’s Clarett interfaces, for example, feature measured dynamic ranges of 116dB on the line inputs and 119dB on the line outputs.
It should be pointed out, first, that these figures are only relevant to 24-bit recording, as a 16-bit recording has a theoretical maximum dynamic range of 96dB, and second, that you are very unlikely to ever find yourself having to record a real-world source with a dynamic range anything like this large. Having more dynamic range available on our recording system merely gives us a little more ‘wriggle room’ in recording typical real-world signals. Nevertheless, a good dynamic range specification across all of an interface’s inputs and outputs is indicative of attention to detail and good design by the manufacturer.
Noise
The third measure of performance that is usually quoted for analogue inputs and outputs evaluates how successfully they avoid adding unwanted additional contributions to the signals passing through them. These contributions fall into two categories: distortion and noise.
In the case of line inputs and outputs, these are usually lumped together in a single measurement called Total Harmonic Distortion plus Noise, or THD+N for short. The idea behind this measurement is fairly simple: we feed in a pure 1kHz sine wave at a known level, and we inspect what comes out the other end for traces of anything that’s not a pure 1kHz sine wave. These will typically be a mixture of distortion products at related frequencies such as 3kHz or 5kHz, and noise, which is anything added that is unrelated to the input signal.
THD+N is sometimes expressed in decibels and sometimes as a percentage, but always measures the ratio of unwanted to wanted material in the signal. Once again, Focusrite’s Red 8Pre represents the state of the art, with THD+N measuring as little as -104dB (0.0006%) on line inputs 9–16 and -102dB (0.0008%) on its line outputs.
For mic preamps, a separate noise measurement is usually given, which is called Equivalent Input Noise or EIN. An ideal mic preamp would perfectly amplify the signal that’s fed to it, but any real-world circuit will inevitably add some noise in doing so. To measure EIN, we connect something that behaves like a microphone in terms of impedance, turn the preamp gain up to maximum, and measure the level of the noise. We then subtract the amount of gain from the measured noise level to return an EIN figure, which will be a negative number in decibels — the more negative the better!
Of all these specifications, equivalent input noise is perhaps the one that’s likely to prove most telling in real-world situations: an interface with low EIN figures and a high gain range will do a better job of recording quiet sources than a less well-performing one. Unfortunately, it’s also the measurement that is most liable to be abused in published specifications. It’s only possible to make a fair comparison of EIN figures between different products if identical test conditions are quoted. By convention, for example, EIN used to be measured without any weighting, but many manufacturers now quote A-weighted figures, which are typically 3 to 5 dB better than the unweighted measurements. It’s also conventional to use a 150Ω source impedance, which is representative of typical microphones, but some manufacturers massage their EIN figures by using a lower source impedance. This can make the figures appear several dB better.
Assuming an unweighted response and a 150Ω source impedance, it’s impossible for EIN to measure lower than -131dBu. In practice, -124dBu is a good real-world figure under these test conditions, while -128dBu would be a good A-weighted measurement. Too often, however, the test conditions are not made public. In this case it is simply not possible to compare EIN specifications and they should be ignored.
Specs Appeal
As far as specifications go, even the least good audio interfaces on the market today perform orders of magnitude better than the recording systems of forty years ago. To actually hear differences in most of the measurements described above, you’d need trained hearing, a superb monitoring environment and a very carefully calibrated test procedure. There are few, if any, real-world recording situations where a difference of 3dB on input dynamic range, or ±0.5dB on frequency response, will be audible.
But does this mean that specifications don’t matter? Not at all. Published specifications are a very good measure both of a manufacturer’s commitment to quality, and of their openness. Where a manufacturer lists full specifications, with all the relevant measurement conditions clearly stated, you can be confident that they have nothing to hide, and that they are proud of the performance of their product. On the other side of the coin, where manufacturers miss out vital information, or arbitrarily change measurement conditions to massage the results, what else might they be hiding?
Further Reading: Understanding Decibels
Many of the measurements you’ll find listed in manufacturer specifications and elsewhere are given in decibels, abbreviated to dB. It’s crucial to understand that a figure expressed only in dB doesn’t represent an absolute level, but the ratio between two levels. So, for example, if the dynamic range of a line output is given as 120dB, this tells us nothing about the peak signal level that can be obtained from this output. What it tells us is that the peak signal level is a certain (large!) number of times higher than level of the the noise floor.
To obtain absolute level measurements, we compare readings with fixed reference levels. A positive measurement indicates the signal is larger than the reference, while a negative measurement indicates that it is smaller. Different references are used in different contexts. For instance, we measure the loudness of sound in air by reference to the quietest sound that is audible by human hearing, and we give the resulting measurements the suffix dBSPL, for ‘sound pressure level’. Any audible sound would by definition register a positive value in dBSPL.
In digital audio, we take as the reference the largest value that the system can represent. This is known as 0dBFS for ‘full scale’. Since nothing within the system can exceed this value, levels in dBFS are always negative, because they always compare a smaller with a larger value.
In analogue circuits, where sound is represented as a changing voltage, the reference value we use is a sine wave at a fixed voltage. The most common standard used in professional audio is dBu, which takes a signal of just under 0.8V as the reference, but you may also find measurements expressed in dBV, which takes 1V as its reference. Note that in both cases the ‘root mean square’ value rather than the peak-to-peak measurement is usually used.
Further Reading: Headphone Loudness
One of the most common complaints that is raised against some audio interfaces, particularly bus-powered ones, is that their built-in headphone outputs don’t go loud enough. Is there a way to tell from the manufacturer’s specifications how loudly an interface will be able to drive a pair of headphones? There should be, but many manufacturers either don’t provide the relevant information at all, or do so in ways that make it hard to compare. As with equivalent input noise, if you are able to compare specifications for headphone outputs, it’s important to be certain that they were made under the same measurement conditions. The standard procedure, as followed by Focusrite, is to feed a full-scale digital signal to the headphone output, turn the volume all the way up and measure the power delivered into a 600Ω load. This will give a reading in dBm (which is a measurement of power, not voltage). So, for example, Focusrite’s figures show that the headphone amplifier in the Clarett 8PreX can deliver 16dBm into a 600Ω load, compared with the 10dBm of the bus-powered Scarlett Solo. The sound pressure level generated by headphones from this input will then depend on the impedance of the headphones, and their efficiency; in general, low-impedance phones with a high efficiency rating will deliver the loudest sound for a given input. Note though that efficiency or sensitivity is sometimes quoted in dB/mW and sometimes in dB/V, which are not the same! Be aware that it is not good practice to listen loudly on headphones for long periods, and doing so can cause serious hearing damage.
Words: Sam Pryor